

Yesterday’s post discussed the costs of turnover in your account—the selling and buying of stocks. I thought it would be instructive to quantify the tax costs of turnover to see just how much it’s worth worrying about. It turns out that over time, the tax cost can be meaningful. Remember, this discussion only applies to taxable investment accounts, since turnover inside tax-favored retirement accounts is tax-neutral; it carries no tax cost.
Let me describe two little experiments. The first applies to those who are not yet retired and are still accumulating assets and the second applies to those who are in retirement and spending down their assets.
The first experiment. Picture a hypothetical person just like you (but not as good looking). At age 30, he’s got $1,000,000 of cash to invest, which he intends to invest 75% in stocks and 25% in bonds. His goal is to accumulate a retirement fund at age 65. Assume all gains are long-term capital gains, and there are no commission costs. Applying reasonable assumptions, with very modest turnover (1% per year, which is about right for an index fund), he can expect to accumulate $4,512,913 in real (inflation-adjusted) dollars, after taxes.
Now change just the turnover assumption to 70% annual turnover (not unusual for an actively managed stock fund). Capital gains tax costs lower the after-tax accumulation at age 65 to $3,677,357. That’s a 19% drop in the retirement fund, which would likely translate into a 19% drop in available retirement spending. Small costs add up!
Now the second experiment. Picture someone age 65, with a $5,000,000 taxable account. She plans to spend an amount which will leave her children with half her wealth remaining if she were to die 30 years hence at age 95. She plans to invest her account 50% in stocks and 50% in bonds. Assume only a modest 1% turnover, and her after-tax allowance from this taxable account is $208,050. Change that turnover assumption to 70%, and her after-tax allowance drops to $190,225. That’s a 9% cut in lifestyle.
Again, turnover matters.
Thursday, April 30, 2009
Wednesday, April 29, 2009
Turnover
Turnover carries costs. I’m not talking about those flaky fruit-filled pastries that Pillsbury sells. I’m talking about the selling and buying of stocks in your investment account.
First, there are the obvious transaction costs. When you sell one stock and buy another, you incur a commission cost. Commission costs have gone down in recent years, but they’re still not zero. Then there’s the spread between the stock’s bid and ask prices, the difference between what buyers are offering to pay and what sellers are willing to sell for. That’s another cost.
There’s also a tax cost if your securities are in a taxable investment account: the capital gains tax you incur if the stock has appreciated. (This tax discussion does not apply to sales inside tax-favored retirement accounts like traditional IRA’s and Roth IRA’s. Which is why those types of accounts can make you a better investor, as described in April 20’s post.) For as long as you hold a stock, its appreciation is tax-free to you. You get to determine when to pay the tax on that appreciation by choosing when to sell the stock. You can defer tax by deferring the sale. In fact, under current law, if you delay long enough and die holding an appreciated stock, your heirs get a new tax basis equal to the stock’s value at the date of your death, so nobody ever pays tax on the appreciation. What a deal! Makes you feel kind of foolish, doesn’t it, for having sold that Google stock the week before you got hit by a bus. (The rule about disappearing gains at death is scheduled to change next year, but there’s reason to believe Congress might act to keep the old rule. Watch this space for developments.)
Under the circumstances, why have any turnover? Well, there are plenty of good reasons for turnover. First, you may own a stock that did well for a while, but which you think is no longer a good investment. Second, you may need to sell an appreciated stock to generate cash to meet your spending needs. You can’t eat appreciation. Third, you may need to sell an appreciated stock to rebalance your portfolio back to your desired asset allocation mix.
But just because you have to have some turnover does not mean it has to be excessive. You can be astute about how you manage your stock sales. You can wait until short-term gain has ripened into long-term gain (generally, after one year and a day), since long-term gains enjoy significantly lower tax rates. You can offset gains by also selling some depreciated stocks. You can arrange your stock sales to serve triple duty: investment changes, cash generation, and asset class rebalancing, all at the same time.
One easy way to reduce excessive turnover is to invest in index funds rather than actively managed funds. By their nature, index funds tend to have low turnover, since not too many stocks enter or leave the index. Conversely, actively managed funds tend to have higher turnover, as fund managers make frequent sell and buy decisions. An in-between approach is to select a tax-efficient stock fund, where the fund managers take tax costs into account as they make their sell and buy decisions.
Okay. So there’s a tax cost to turnover. Just how significant is that cost? More on that tomorrow.
Tuesday, April 28, 2009
Frequency of Losses—Asset Class Mixture
Sunday’s post looked at one aspect of risk—a very narrow aspect, at that—and compared the riskiness of stocks and bonds. But of course nobody ought to have all of their retirement investments solely in one asset class or another. How risky is investing if your assets are in a mixture of stocks and bonds?
I’m glad you asked. The green line in the graph below builds on the information shown in Sunday’s post. It answers the musical question, “In the past, how frequently would you have experienced a real (i.e., inflation-adjusted) loss if your assets were invested 50% in stocks and 50% in bonds?”
As in Sunday’s post, the answer depends on how frequently you choose to measure your investment progress. Historically, a 50%-50% mixture of stocks and bonds has been slightly less risky—at least as measured by this particular and narrow dimension of risk—than either stocks or bonds standing alone. If you had looked at your investments every calendar year, your mixture would have shown a real loss during 31% of the 83 years studied. That is slightly better than 33% for 100% stocks and 39% for 100% bonds.
And, as with stocks alone or bonds alone, the green line shows a generally decreasing frequency of real losses as you increase the length of time between measurements. With a 50%-50% mixture, in the past 83 years there has been no period of 18 years or longer during which such a mixture exhibited a real loss.
Important: Note that the green line is mostly lower than either the blue line (100% stocks) or the red line (100% bonds). Which means that a nice mixture of stocks and bonds has proven less risky than putting all your eggs in one basket. At least as measured by this particular (and limited) facet of risk.
But, like a Batman villain, risk has many faces. More to come.

Monday, April 27, 2009
The 4% Plan vs. 3% Plan vs. 3.5% Plan
A number of prior posts have mentioned the 4% Plan. That’s one of a few schemes for rationally spending down your assets once you have retired and switched from saving to consuming. But whether 4% is the “right” number will depend on many factors. One of them is the type of savings buckets in which your assets dwell.
First, what is the 4% Plan? Under the 4% Plan, you add up your investment assets on the day after your retirement party, multiply by 4%, and that’s your budget for the year. Then every year you increase the dollar amount by the prior year’s inflation, and you've got yourself a new budget. I’m not crazy about the 4% Plan, but at least it’s a plan, and it's simple enough.
Of course, nothing’s simple. Because taxes matter, and one of the important variables we have glossed over is this: In which of the three main types of savings buckets do your assets sit? Are they in a pre-tax retirement account like a traditional Individual Retirement Account? Or a newfangled Roth account? Or a taxable investment account? (Chances are they are in some combination of the three, but for the sake of discussion, let’s pretend they are all in one or another.)
Here’s why the answer matters. The number 4% was arrived at by financial professionals to result in a distribution amount that is as big as possible, while still maintaining a high likelihood that you will not run out of assets during your lifetime (or the joint lifetimes of you and your spouse). The professionals who arrived at that figure assumed your assets were invested in a traditional tax-favored retirement account, like a 401(k) account or IRA.
So let’s follow that through. Let’s say on your retirement day you have $1,000,000 saved in a traditional IRA. You figure 4% is $40,000, so that (plus future inflation) is your budget. But what about taxes? You haven’t paid taxes yet! If, for example, your overall marginal income rate is 25%, then $10,000 goes to pay your taxes, and you are left to live on $30,000. You can’t eat taxes. 4%, it turns out, is the rate at which you can deplete the account; not necessarily what you get to spend. That looks more like 3%.
Now let’s change the facts. Say you have the same $1,000,000, but it’s not in a traditional IRA; instead it’s in a Roth IRA. Your sustainable distribution is the same 4%, or $40,000, but now all income taxes have already been paid, so you get to spend the whole $40,000 on yourself. With a Roth savings bucket, 4% is truly 4%.
One more scenario. Assume the $1,000,000 is in a taxable investment account. You’ve already paid income taxes on that $1,000,000 so you get to spend your entire distribution on yourself. But it should be a bit less than 4% in this case. I’m not sure how much less, but I think probably around 3.5%, or $35,000 in the example. Why do you have to shave the 4% down? Because the professionals who came up with the 4% number assumed you were investing your $1,000,000 in some sort of tax-exempt environment, like an IRA, in which you would not have to pay income tax on your investment earnings (although you would have to pay income tax on your distributions, as we saw two paragraphs above). So if your investment returns (not your distributions) have to be shaved by income taxes, it stands to reason that your long run sustainable distribution percentage will have to be shaved as well. Perhaps down to 3.5%. For a description of the factors that go into this particular haircut, see February 3’s post.
As I said, in reality your retirement savings will likely be housed in all three types of savings buckets, so your own spending percentage will be some blend of the three numbers.
Oh, by the way, your own percentage will also vary depending upon your asset allocation plan. But that discussion is for another day.
Sunday, April 26, 2009
Frequency of Investment Losses
There are many, many facets of investment risk and uncertainty. I catalogued a bunch of them in March 16’s post. Today’s post focuses on just one aspect of investment risk: How frequently can you expect to experience a loss?
First, let me narrow the inquiry. How frequently might you expect to experience a real, i.e., inflation-adjusted, loss? If you just look at the nominal value of your account, your perceived losses will be much less frequent. But we’re much too wise to ignore the hidden loss engendered by inflation. So we’ll ask the question “How frequently can you expect the inflation-adjusted value of your account to decline when you invest in different asset classes—stocks and bonds?”
Not surprisingly, the answer depends on how frequently you look at your account statement. The shorter the interval, the more frequent the incidence of real loss. Time erases all losses. Time also erases outsized gains, but that’s an inquiry for another day; today we look at losses.
If you look at your investment results every calendar year you’ll find that a sickeningly high percentage of the time you will have realized an inflation-adjusted loss. 33% with stocks and 39% with bonds. Where did these percentages come from? I looked at the 83 years from 1926 through 2008 (yes, that horrible 2008). For stocks, I measured the total return on the S&P 500; for bonds, I measured the total return on intermediate term treasury bonds; for inflation, I measured the change in the Consumer Price Index.
But if you expand the interval between measurements—increasing the interval from one year to every two years, things improve a bit. The percentage of losing periods drops to 27% for stocks and 32% for bonds. And so the trend continues, as shown in the graph below. Although the trend is more pronounced for stocks than for bonds. By the time your time horizon increases to 18 years, you find that stocks have not shown a real loss for any period of 18 years or longer between 1926 and 2008. For bonds, the magic number is somewhat higher—the interval has to be 50 years before you can say bonds have never exhibited real losses during the 83 years studied.
So time heals all losses. But there’s four hairballs on this particular lollypop: (i) the future might be worse than the past; (ii) you might simply not have enough time to recoup your losses; (iii) the scariness of the ride along the way (think 2008) might cause you to change your asset allocation in ways you’ll later regret; and (iv) the graph says absolutely nothing about the magnitude of losses, just the frequency. Magnitude is for another day.

Saturday, April 25, 2009
Refundable vs. Nonrefundable Saver’s Credit
Yesterday’s post described the Saver’s Credit, a taxpayer-paid matching contribution designed to encourage and assist low income workers to save for their retirement. In a thoughtful comment, David highlighted the purpose of the Saver's Credit, which is to asist low-income workers in saving for their own retirement.
Which leads me to focus on one particular feature of the Saver's Credit: it’s a nonrefundable credit. That’s tax jargon for a credit that is limited to your tax liability. A nonrefundable credit can only operate to reduce your tax liability. If your potential credit is a dollar more than your tax liability, you don’t get that extra dollar.
There’s currently a bill recently introduced into the House of Representatives by Congressman Pomeroy (H.R. 1961) that would turn the Saver’s Credit into a refundable credit. If your potential Saver’s Credit exceeds your tax liability for the year, the taxpayers give you a refund anyway—although “refund” is a poor choice of words, since the dollars would come from other taxpayers.
What is the point of drawing a bright line at your tax liability? Opponents of refundable credits call it welfare, since the refundable part comes from other taxpayers. If you limit the credit to tax liability, it’s easier to characterize it as a tax reduction. (“Welfare,” “tax reduction.” Words are really loaded, aren’t they?) Proponents of refundable credits note the arbitrary nature of the line that’s being drawn at the taxpayer’s tax liability. If she’s engaging in the favored activity that generates the credit, why draw a line at her tax liability? Particularly as the complexity of the Tax Code, with all its other deductions, exemptions and credits, makes that line increasingly arbitrary.
It’s instructive to note what other credits in the Tax Code are refundable. What activities are so favored by Congress that they are willing to have other taxpayers support the activity? The big one is the earned income credit, which constitutes taxpayer help for the working poor. There are also a couple of narrowly targeted credits aimed at farmers with high fuel costs and some unemployed individuals who need help with their health insurance costs. Most other credits—the child tax credit, adoption assistance, dependent care, the list is a long one—are nonrefundable. Congress just hates stepping over that line.
So what do I think? (Actually, nobody really asked me, but I have the floor.) I favor making the Saver’s Credit refundable. In my view, helping low income workers save for their retirement falls into the same category as the earned income credit for the working poor. They’re doing everything society wants and encourages them to do, yet often through no fault of their own they need help making ends meet. They’re exactly the ones the rest of us, through our tax dollars, ought to encourage, assist and support. They're the productive ones, the good guys.
Besides, if you look at the way the Tax Code is structured, you get the definite sense that deductions and credits serve fundamentally different purposes. Deductions are generally aimed at figuring the "right" measure of your ability to pay income tax. Credits, on the other hand, are designed to encourage specific activities; they are not germane to calculating your fair share of the country's overall need for tax revenue.
So what do you think? I’d like to know. Send me an email at TheTwoLeggedStool@gmail.com. Or, better, post a comment.
Friday, April 24, 2009
The Saver’s Credit
Your federal government wants you to save for your own retirement. In fact, they want it so much they are willing to give you a matching contribution of sorts. But only if you have low income. In other words, you can get a reward for saving only if you are too poor to afford to save. Oh well.
Notwithstanding that Catch 22, there are plenty of people who can afford to save for retirement and who meet the requirements to benefit. Here are the ground rules.
• This governmental benefit comes in the form of a tax credit. It’s not an actual matching contribution, in that it’s not added to your retirement account, like your employer’s 401(k) match. Rather, it comes to you in the form of reduced income tax liability (or an increased refund) come April 15. So your tax credit ought to free up an equivalent number of other dollars, enabling you to increase the amount you otherwise were able to contribute to a retirement plan. Economically, the tax credit can act just like a matching contribution. That’s the theory anyway.
• The tax credit is not a refundable credit. That means it is limited to no more than your income tax liability for the year. Unfortunately, this takes a lot of low-income people out of the running.
• You become entitled to the credit by contributing to a tax-favored retirement plan of some kind, either an Individual Retirement Account, a Roth IRA, or your own contribution to a 401(k) plan, 403(b) Plan, 457 Plan, or SIMPLE IRA Plan.
• The maximum contribution that’s matched is $2,000 per year.
• The credit percentage, or matching percentage if you will, is based on your Adjusted Gross Income. The lower your Adjusted Gross Income, the higher your matching percentage. It starts out at a healthy 50% match if your AGI (in 2009) is under $16,500 ($33,000 if married), and ratchets down to 10% if your AGI is under $27,750 ($55,500 if married). AGI above those amounts, and you’re out of luck. No credit for you!
• To avoid abuses, your contribution that otherwise entitles you to a tax credit is reduced by any recent distributions you took from a retirement plan—during the year of your contribution or the following year up to the due date of your tax return, or either of the two preceding years.
• To avoid even sneakier abuses, your matched contribution is also reduced by recent retirement plan distributions taken by your spouse. They’re up to your tricks, you rascal.
• Those under age 18, full time students, and those claimed by a parent as a dependent cannot qualify for the saver’s credit.
• You claim the credit by filing a Form 8880 with your tax return.
If you meet all these requirements, you have extra reasons to strive to put away a little something for the future.
Thursday, April 23, 2009
Roth Accounts for Federal Employees?
Riddle: What does a Roth 401(k) account have to do with smoking cigarettes?
Answer: Read on.
I am a big fan of Roth savings, as expressed in a number of prior posts; particularly for those who would like to save more in their tax-favored retirement plans, but are prevented from doing so because of limitations in the Tax Code. So Roth 401(k) accounts, potentially available since 2006, have been a great recent development, since they carry no income-related restrictions. But Roth 401(k) accounts are only an option if your employer chooses to make them available.
What about federal employees? Federal employees are covered by the Thrift Savings Plan, a 401(k)-like retirement savings plan. Unfortunately, there is no provision for Roth accounts in the Thrift Savings Plan, so federal employees are out of luck.
But that may change soon. The Board governing the Thrift Savings Plan has this week endorsed a proposal to add a Roth option to the TSP. That’s the good news. Now here’s the bad news: actually adding such a feature requires legislation. The House of Representatives passed a bill adding Roth accounts to the TSP, but the Senate and President also have to act.
Now back to the riddle: What does Roth saving have to do with cigarette smoking? In the real world, nothing. In Bizarro congressional world, apparently they are deeply related in ways the rest of us can’t begin to fathom. The provision for adding a Roth savings option to the TSP is included in a bill to give the FDA authority to regulate tobacco. So whether federal employees get a favorable retirement saving opportunity may hinge on how your senator feels about giving the FDA the power to regulate tobacco.
Federal employees, join the rest of us. We in private industry only get Roth opportunities if our employers choose to add it to our 401(k) plans; you only get them if your senator believes in federal regulation of tobacco.
Wednesday, April 22, 2009
Longevity Risk and Market Risk
Yesterday’s post made a point about saving up a sufficient amount to meet your retirement needs. And the point was this: that in a world of many uncertainties, the uncertainty of how the financial markets will treat all of us exceeds the uncertainty of how long your particular lifespan will be.
And today’s point is this: So what! You have to live with both uncertainties. You don’t get to choose one or the other.
There is a silver lining of sorts: The financial risk of an extra-long life is presumably independent of the risk of an extra-crummy market environment. (Then again, maybe they’re not independent. Maybe suffering through a bad market environment makes you want to die. I know it’s making me pretty sick.)
Assuming they are unrelated, your true financial risk is that you will suffer through both bad situations simultaneously. This point was made by Messrs. Blanchett and Blanchett in the article discussed in January 14’s post. (I shouldn’t refer to long life as bad. Long life is generally a good thing. It’s just the financial aspect of it that’s bad.)
How does this affect Goldilocks from yesterday’s post? If she saves enough to meet her projected needs for an average life expectancy in an average market environment, she actually has about a 75% chance of not running out of money while still alive. That’s not too bad. (Caveat: These percentages incorrectly use the historical performance of the financial markets to measure the likelihood of future success. It's wrong to do that, but I do it anyway. Like eating potato chips.)
Unfortunately, Goldilocks gains only diminishing returns in her level of certainty as she increases her savings. For example, building up her retirement savings by an additional 30% gets her from a 75% up to about an 88% chance of not outliving her life retirement savings.
Don’t you just hate uncertainty?
Tuesday, April 21, 2009
Longevity Risk vs. Market Risk
Words matter. The words that are used to describe something color—even distort—how we think about that thing, and can easily mislead us.
I read an article about a retired person’s risk of running out of money before she runs out of pulse. Financial professionals call that “longevity risk.” What I don’t like about those words is the connotation that running out of savings during retirement is somehow your fault. You chose to live too long, you selfish Baby Boomer. It’s not something that happened to you, it’s something you brought on your own damn self. Or maybe it’s your parents’ fault for bequeathing you such sturdy genes. Where’s George Carlin when we need him?
But the risk of living too long is minor compared to the risk of living through a crummy market environment. And the market environment is not something you brought on yourself, like healthy living; it’s something that’s thrust upon you (and all your classmates) by the accident of when you reached retirement age. 1926? A great year to retire. 1969? Terrible.
In what way is market risk greater than longevity risk? Here’s a little fairy tale.
Goldilocks has turned 65 and is about to retire. She needs for her savings to generate $50,000 per year, plus inflation. She has saved up $649,271, which, it turns out, is just right if she lives an average female life expectancy (which at age 65 is 20 years) and retires in an average market environment.
But wait! Goldilocks is smarter than that. Despite the bear thing, which happened when she was very young, so it doesn’t count. She realizes she might live longer than average. So to be cautious, she magically increases her savings to $849,006. (This is a fairy tale, so she can do that.) That’s the amount she’ll need if she lives to age 98, which only 5% of 65-year-old women are expected to do. (These projections came from a table of life expectancy statistics on the Social Security website.) So by increasing her savings by $200,000 she is 95% sure not to get stung by longevity risk.
But wait! What about market risk? Goldilocks prudently plans to invest her savings 50% in stocks and 50% in bonds. What if the upcoming future for stock returns, bond returns and inflation is worse than the historical average? It turns out that market risk is much scarier than longevity risk. Goldilocks studies 83 20-year periods from 1926 through 2008 and sees that during 10 of them—more than 15% of the time—her extra $200,000 of extra savings would have been an insufficient cushion; she would have run out of bucks before the end of her average 20 year life expectancy.
Goldilocks's extra $200,000 of savings bought her 95% certainty of avoiding longevity risk, but only 85% certainty of dodging market risk.
It turns out that market risk—the one that’s shared by you and everyone who got the gold watch in the same year—is bigger than longevity risk—the one that’s unique to you. And 2008 turned out to herald a very inauspicious start for the current crop of graduating retirees. Can you just picture a whole cohort of 65-year olds, eyes glazed over, all wandering around Miami Beach at 4:30, all looking for the same early bird special?
Monday, April 20, 2009
The Better Investor Savings Bucket
There are many nice tax savings features of tax-favored retirement accounts—Individual Retirement Accounts, Roth IRA’s, 401(k) Plans, etc. And I’ve written a large number of posts about them. One of the subtler benefits of tax-favored retirement accounts compared to taxable investment accounts is how they make you a better investor.
Think about it. When you have your savings in a taxable investment account, the income tax consequences taints every investment move you make (or neglect to make).
• You tend to prefer tax-exempt municipal bonds over treasury or corporate bonds—so you don’t have to pay federal income tax on the interest.
• You tend to prefer your own state’s municipal bonds over your neighboring state’s, so you don’t have to pay state income tax on the interest.
• You tend to prefer stocks over bonds so you can benefit from temporarily tax-free appreciation and lower-taxed capital gain instead of taxable interest.
• You tend to prefer growth stocks over dividend-paying stocks for the same reasons.
• You tend to hold onto stocks that have substantially appreciated to avoid triggering a whopping capital gain.
• For the same reason, you tend to avoid rebalancing your mix of stocks and bonds to get back to your desired asset allocation.
• You tend to hold onto recently purchased stocks for longer than you might otherwise wish so you can turn high-taxed short-term gain into low-taxed long-term gain.
• As you age, you tend to hold onto highly appreciated stocks so your family can benefit from the increase in tax basis that occurs at death. Which some days feels like it’s just around the corner, doesn't it?
• When your stocks lose value, you tend to sell them prematurely for no other reason than to benefit from the tax losses.
All of these distortions in your thinking and acting just melt away when your investments are in a tax-favored retirement account. The shelter of its tax-exemption allows you to make the right investment decisions untainted by extraneous tax consequences. Goodness knows it’s hard enough to do that without the Tax Code breathing down your neck.
Sunday, April 19, 2009
Your Teenager’s Retirement Saving
Teenagers. Ya gotta love ‘em. It’s like having your own personal Linda Blair around the house. As long as you’ve got to get yourself and your kids through the high maintenance teenage years, you might as well impart some good habits along the way. Like acceptable hygiene. And retirement saving.
When they get that first summer or after-school job, they are going to have a lot of discretionary income—a lot compared to what they need and are used to. So there’s no better time than the teenage years for them to begin the saving habit—setting aside a portion of their working income in a savings bucket of one kind or another. Saving is like playing baseball or doing crossword puzzles or lifting weights or playing guitar—the more you do it, the better you get at it. It becomes second nature. So there’s no better time for a person to learn how to save than when she has her first taste of discretionary compensation.
You might even encourage your kids’ saving habit by subsidizing it. Maybe give them a dollar for every two they put away in a savings bucket, so they can continue to enjoy some of the consumption benefits of their hard-earned income. It’ll be like your own family matching contribution.
So what’s the best kind of savings bucket for a teenager? That’s a no-brainer. It’s the Roth IRA! Teenagers don’t have much income (except for Miley Cyrus) so they usually meet the qualification rules for contributing to a Roth IRA, as described in February 4’s post. And for a teenager, the tax cost of foregoing a deduction (had they instead contributed to a traditional IRA) is very small; maybe even zero. Then the dollars they put aside—and every dollar of investment earnings for the next 70 or 80 years—is totally tax-free. What a deal!
Now don’t you wish you were a teenager again so that you could start your own Roth IRA? When I was a teenager there was no such thing as IRA's or Roth IRA's. Or electricity. Or the wheel.
Saturday, April 18, 2009
Planning for Disclaimers
In a few recent posts, I have described how disclaimers work, and how they can be used by your beneficiary after your death to reroute your retirement benefits. Like most things, disclaimers work best if your planning has been done before your death, rather than afterward. And like most things, planning works best if you’ve talked to your loved ones, and have a good idea of what they might want.
Here are a few variations:
• The original idea was mentioned by noted retirement expert Ed Slott, and described in April 15’s post. It is also the most common. Here is a recap: You name your spouse as primary beneficiary, with your children, equally per stirpes, as contingent beneficiaries. Then if you die (actually, not “if” but “when”), if your spouse does not feel she needs your entire retirement account, she can disclaim a portion and that portion then goes to your children.
• The disclaimers don’t have to stop there. If one of your children is then feeling equally magnanimous, he can also disclaim a portion of his share, and the disclaimed portion will go to his children—your beloved grandchildren, they should live and be well. (An aside: This highlights the importance of ensuring that you write your Beneficiary Designation Form so that if a child predeceases you, his share goes to his kids and not his siblings. That’s the import of using the words “per stirpes.”)
• If your primary beneficiary (your spouse, say) has a charitable bent, you can name her favorite charity as contingent beneficiary. Then to the extent she disclaims, the retirement account goes to her favorite charity. That is often a tax efficient way to get dollars from a traditional retirement account to a charity.
• If your family is wealthy enough to be concerned about estate taxes (you lucky dog!), you can name your spouse as primary beneficiary with a trust for your spouse as contingent beneficiary. Then by disclaiming a portion, your spouse can cause your estate to take better advantage of the $3,500,000 estate tax exemption. And she can still benefit from the trust! What a country!
• If your family is wealthy enough to be hit by estate taxes, be sure your Will has a clause that allocates additional estate taxes that might be caused by a disclaimer to the branch of the family benefiting from the disclaimer. Fair’s fair.
So talk to your family. Before you die; not afterward.
Friday, April 17, 2009
Rules Governing Disclaimers
In yesterday’s post, I described the consequences of disclaiming your entitlement to receive a retirement account left to you by a recently deceased person—a spouse, a parent, whatever. “Well,” you might be thinking, “this could be useful. How do I do one of those disclaimer things?” As might be expected, there are plenty of requirements to meet. Here is a summary of them.
1. The disclaimer has to be an unqualified refusal to accept the property. You can’t reserve the right to change your mind.
2. The disclaimer has to apply to either the entire property or to a fractional part of it. For example, if someone has named you beneficiary of an IRA, you can keep 75% of it and disclaim your right to 25% of it.
3. The disclaimer must be in writing.
4. The writing must be delivered to the transferor of the property. In the case of a retirement account, that means the trustee or custodian of the account.
5. The written disclaimer must be delivered no later than nine months after the decedent’s death (or nine months after you turn 21, if later).
6. You must not have accepted any benefit from the property. There’s some leeway here. In a magnanimous ruling the IRS said that if all you took from an IRA is the required minimum distribution for the year of the decedent’s death, it’s still not too late to disclaim the rest of the IRA. Nonetheless, this particular requirement can easily trip you up. It might mean, for example, that you had better not take control of the retirement account’s investments if you are later going to disclaim. Who knows?
7. As a result of the disclaimer, the property must pass to the ultimate recipient without any direction from you. That means you don’t get to say who gets it; that’s determined by the decedent (now, alas, gone to his reward) based on the way he wrote his Beneficiary Designation Form.
8. You cannot benefit from the disclaimed property. For example, if you are the primary beneficiary of your parent’s IRA, and the contingent beneficiary is a trust under which you are also a beneficiary, then the disclaimer won’t qualify. In order to make it work, you would have to disclaim your rights under the trust as well as disclaiming your rights under the IRA. This particular rule doesn’t apply to surviving spouses; but it applies to all other types of beneficiaries.
9. Your disclaimer has to meet all the requirements of your state’s laws governing disclaimers.
So those are the ground rules in a nutshell. Pretty tricky, huh? That’s why it’s important to get a competent knowledgeable lawyer involved whenever you venture into disclaimer world.
Thursday, April 16, 2009
About Disclaimers
In yesterday’s post, I described an idea for how your heirs can utilize a disclaimer after your death. I don’t usually like to write about death in this retirement planning forum; it's just not seemly. But I suppose it’s appropriate for me to summarize the ground rules governing disclaimers. Someone has to do it. Here goes.
What is a disclaimer? Imagine you are entitled to receive something as a result of someone else’s death—a bequest; a house; life insurance proceeds; a retirement account; whatever. Now imagine—and this is the hard part—you don’t want it. You can simply refuse to accept it, and then it goes to the next person in line, just as if you had died before your benefactor. That’s a disclaimer.
If the disclaimer is handled properly, then for tax purposes it’s treated as if you had never been entitled to the property in the first place. It’s treated as if the deceased person had instead left it to the ultimate recipient instead of you. If the property is a retirement account, like an IRA, here’s what that means:
• Most significantly, the ultimate recipient, and not you, becomes entitled to the account. Duh.
• The ultimate recipient, and not you, pays income tax on distributions (unless it’s a Roth account). That could be a good thing for the family if the ultimate recipient is in a lower tax bracket as typically happens when he is one or two generations younger.
• The ultimate recipient’s life expectancy governs required minimum distributions, rather than yours. That would enhance the tax deferral benefits of the retirement account if the ultimate recipient is a generation or two younger than you.
• The estate tax consequences of the retirement account are determined as if the account was left directly to the ultimate recipient. (The import of that statement will just have to wait for another day.)
So that’s it in a nutshell. Tomorrow’s post will summarize the ground rules for properly implementing a disclaimer.
Wednesday, April 15, 2009
Retirement Accounts and Disclaimers
In yesterday’s post, I mentioned a TV show I saw on PBS presented by Ed Slott, noted authority on retirement planning. Buried in the two-hour show was a little gem of advice about leaving your retirement accounts to your kids. Here it is in a nutshell.
As I’ve mentioned before in March 20’s post, it’s almost inevitable that your children will inherit some meaningful retirement assets from you. Why? Because with all of life’s uncertainties, it’s hard to die broke. So whatever’s left usually goes to the kids.
But what if things go well for you, and after the first spouse dies, the surviving spouse feels like she’s got more than enough to sustain her for the rest of her life? Then the surviving spouse can make the decision to leave the deceased spouse’s retirement accounts—or some appropriate fraction of them—to the kids. How? By executing a proper “disclaimer.” What’s that, you ask. It’s a refusal to take what’s coming to her as a result of the death of her spouse. Then the disclaimed property goes to the next in line, which, if you’ve set it up properly, is the kids.
If your surviving spouse is feeling flush, and wants the kids to get a little inheritance today, rather than waiting for the next death, your retirement accounts make an excellent vehicle for this largesse. Why? Because with their longer life expectancies, they can turbo-charge the tax benefits of your retirement accounts, as pointed out in March 20’s post.
How do you set up this play for your surviving spouse and children? It turns out it’s not only easy, but it fits well with what you’re no doubt planning to do anyway: Name your spouse as your primary beneficiary on the Beneficiary Designation Form that comes along with your retirement accounts. In the space for “contingent beneficiary” (you know, the person who gets the dough if your named primary beneficiary has predeceased you), name your children equally per stirpes. Then when the grim reaper comes for you, your spouse (the one you really want to provide for) can accept her inheritance; or if she feels she can afford it, she can disclaim part of it and allow the kids to enjoy part of their inheritance while they’re in their high-maintenance years. Thanks for the good idea, Ed.
But wait, there’s more! What if one of your kids is also feeling pretty flush and would rather his inheritance goes to his own children, your grandchildren? Your child can also execute a disclaimer, allowing all or a part of his inherited retirement account to pass just as if he too had predeceased you. Then it goes to his kids. With their very long life expectancies, the value of those retirement accounts just got bigger. (See March 21’s post.) A good idea just got even better!
And the beauty of it is that the decision is not made by you today, but rather by those who survive you, and therefore have better knowledge of whether they can afford to be generous.
A word of caution. Disclaimers are tricky, and must be executed properly and promptly (within nine months of death) for them to work. So be sure your survivors consult with a competent and knowledgeable lawyer before trying to implement this idea. I know, you’d rather stick your left thumb in a wood chipper than get a lawyer involved, but this is an area where that’s the prudent thing to do. I mean involving a lawyer.
Tuesday, April 14, 2009
Ed Slott’s Retirement Planning Advice
This is hard to believe, but I saw a TV show about retirement planning. Not only that, but it was two hours long. Not only that, but it was on a PBS station. Not only that, but it was shown as part of their annual pledge drive to get you to send them some dough. You’d think they would show reruns of Simon and Garfunkel in Central Park from 25 years ago; but, no, instead it was a lecture by noted authority Ed Slott on securing your retirement. (Thanks to my friend Denis who alerted me to the show, so I could DVR it and skip over the pledge parts.)
Of course, it’s hard to convey lots of good little ideas in a two-hour mass-audience TV show, but he did an excellent job of summarizing the big picture:
• Know where you stand;
• Educate yourself about your options;
• Get good advice;
• Take the long view;
• Take action in small consistent steps.
You’ve got to agree with him on these recommendations.
Not surprisingly, Mr. Slott turns out to be a big fan of the benefits of Roth savings. His take on it is that with the amount of borrowing we do as a society, and the concomitant deficits we’re running, tax rates are bound to increase, so it will turn out to be a bargain to pay your tax obligation on your retirement accounts now, when tax rates are at historic lows, before they inevitably rise to dig us out of the hole we’ve gotten ourselves in. It’s hard to argue with his logic.
Buried in Ed Slott’s big picture was a small-picture idea that I thought was pretty clever. I’ll use tomorrow’s post to pass it along.
Monday, April 13, 2009
Investments and Diversification
Aesop said, “Don’t put all your eggs in one basket. “ Or maybe it was Benjamin Franklin. Anyway, it was one of those know-it-alls.
That homily applies to your investments as well. Once you have an asset allocation plan, you will have to fill up your stock percentage with various stocks, and your bond percentage with various fixed income investments. One rule that should guide that process is the principle of diversification. Do not have too large a percentage of your stocks in the stock of any single issuer, or in any single industry, or even in any single financial sector or country. Why? Because by concentrating your assets in one company (or industry or financial sector or country), you run the risk that a single adverse event, always unanticipated, can decimate your retirement fund. That’s an extra risk you do not need to take. By spreading your stocks among a number of companies (and industries and financial sectors and countries), you increase the likelihood that a downturn in one company (or industry, financial sector or country) will be offset by superior performance elsewhere. The risk of concentration is potentially enormous (think Enron).
Moreover, according professor and economist Burton Malkiel in his classic book A Random Walk Down Wall Street, many financial professionals believe that the markets do not even reward you with any extra return for taking that extra risk. What a lousy deal that is!
How much concentration is too much? Opinions differ, but a good rule of thumb is to avoid having more than 5% of your stocks in any single issuer. That’s 5% of your stocks, which is an even smaller percentage of your overall investments.
There is one particular type of concentration problem to be wary of: owning too much stock in the company you work for. That’s an easy trap to fall into. Companies often like to fill up their 401(k) plans with their own stock. They often make matching contributions in the form of company stock. Or they make company stock the default investment option. They sponsor ESOPs, which by design are intended to be invested primarily in company stock. They sponsor plans that enable employees to purchase company stock at a discount. They reward employees with bonuses in the form of shares of stock and stock options. Companies like to do this because it supposedly encourages employees to work toward profitability for their own benefit. But it adds extra uncompensated risk to your investments.
And, worse, looking at your bigger financial picture, if your company goes under, you lose your job at the same time your portfolio gets decimated. Again, think Enron. So it’s a good idea to keep an eye on how much company stock you own, directly and indirectly, and adjust it downward where you have the power to do so, if the percentage gets too high.
I understand that your company is different. It’s not Enron. It’s the beast of its industry. I don’t care! It’s good to be loyal and true to the home team, but at some point it’s prudent to put a cap on your loyalty.
Sunday, April 12, 2009
Investment Returns and Market Timing
Given the extreme swings in stock prices, wouldn’t it be better just to get out of stocks before they go down, and reinvest in them before they go back up?
Forget about it! That’s called market timing and it can’t be done. Despite the tens of thousands of highly paid Wall Street professionals spending all their working hours studying the stock market, nobody has been able to consistently predict when the market will turn up or down. Successful market timing requires that you make two correct guesses—when to sell stocks and then when to buy back in. And it is critical that you make that second call correctly. For example, according to economist and mathematician Benoit Mandelbrot, in his book The (Mis)Behavior of Markets, during the 1980s, 40% of the gains in the S&P 500 occurred on just 10 trading days; miss those days and you miss a big chunk of stocks’ performance. The risks of being out of the market when it goes up actually exceed the risks of being in the market when it goes down.
Here’s a little fable as to why it is foolish to think you can guess right where all others have failed. I owe this to an example appearing in Roger Gibson’s brilliant investment book Asset Allocation.
Imagine that you begin January 1, 1926 with $10,000 to invest. Now imagine that you are successfully able to guess correctly whether the upcoming month is going to be good for stocks or bad. When you sense that stocks will outperform cash, you keep your assets in stocks, specifically in the stocks that make up the S&P 500. When you sense that cash will perform better than stocks in the upcoming month, you sell and move your assets into cash. By the end of 2007 your account would be worth over $400 trillion, more than thirty times the actual market value of the S&P 500, clearly an impossibility. If you could successfully predict the direction of the market, your wealth would grow so large that your trading would influence the market.
The moral of the story is to find your appropriate asset allocation and then stick to it, rather than to try outguessing Mr. Market.
Saturday, April 11, 2009
Investment Returns and Asset Allocation
In yesterday’s post, I included a graph showing how stocks and bonds have performed over different time horizons. But of course, you will not invest all of your retirement assets in one asset class or the other. To find the right compromise between the higher return of stocks and the greater stability of bonds, you will want to arrive at the right mix of stocks and bonds—your asset allocation plan. More easily said than done.
The graph below shows quite clearly how mixing the two asset classes has historically resulted in gains and losses that are in between those of stocks and bonds. There are good reasons for mixing asset classes. Most of us want the higher returns offered by stocks, but we could not afford the potential losses if all our investments were in stocks.
And stocks and bonds will behave differently during different economic periods. To some extent poor performance of one asset class will be offset by better performance in the other. This will result in a reduction of volatility, a smoothing of the peaks and valleys of your investment returns. The graph below demonstrates this by showing how a portfolio of 50% stocks and 50% bonds would have performed during different periods in history (the same periods reviewed in yesterday's post), and comparing that mix to 100% stocks and 100% bonds.
Is 50-50 the right asset allocation? No; it’s just an example.

Friday, April 10, 2009
Investment Returns over Multi-Year Periods
It’s all about your time horizon.
In the last few posts, I have quoted some statistical returns for stocks, bonds and inflation, but only looking at single-year periods. It turns out those figures are not very helpful, since we all invest our retirement assets for some longer-term period, our “time horizon” in investment industry jargon. How many years will it be before you will have to cash in your investment and spend the proceeds? The longer the time horizon, the more stocks have done better than bonds.
Over longer periods of time, inflation poses a greater risk than depreciation in stock value. Conversely, the shorter your time horizon, the less appropriate stocks are. The risk of a short run loss in value over one or two years is too great to make it worth trying to strive for their greater returns.
The following graph shows how stocks and bonds have fared historically over two, five, 10, 20, and 30 year periods. The blue bars show the range of annualized real (i.e., after-inflation) returns experienced by stocks (as represented by total return on the S&P 500 index) and bonds (as represented by total return on intermediate term Treasury bonds) during the period 1926-2008. Inflation is represented by changes in the Consumer Price Index. The black bar shows the median return for all periods during the 83 years studied.
This graph paints an important picture. Notice that stocks have performed well over longer periods of time. In fact, they have outperformed bonds in every 20-year and 30-year period from 1926 to 2008. According to author and finance professor Jeremy Siegel, in his book Stocks for the Long Run, not since 1831-1861 have fixed income investments outperformed stocks over a 30-year period. And that remains true for the 20- and 30-year periods punctuated by the positively horrible 2008.
Another important thing to notice from the graph is how the wild swings in returns, in both stocks and bonds, are increasingly muted as your time horizon expands. Time erases your losses! Unfortunately, time also erases your outsized gains. The longer the period, the smaller the range of annualized returns. For example, annualized real returns in stocks over short (2-year) periods ranged from a whopping gain of 43% to a sickening loss of 29%; a spread of 72%. But over 20-year periods, the range of annualized real returns in stocks shrank considerably—to a high of 13% and a low of 0.85% (a mere14% range).
A third thing to notice is how the median return stays roughly the same no matter how long or short the period. Moreover, as the range of returns shrinks with ever-longer time horizons, the median becomes much more useful as a tool for projecting the future, since your future is more likely to be closer to the median than with shorter periods.
After you have experienced a year like 2008, it is a bit comforting to remember that time can heal your outsize losses. But it is equally critical to remember that if you invest your retirement assets in stocks, you can always expect to experience many individual one-year periods of significant real losses (one out of three calendar years between 1926 and 2008, as seen in yesterday’s post). And often those one-year periods follow on each others’ heals, making for quite the sickening ride. It takes courage and conviction to get through the short-term downs in order to benefit from long-term gains.
Now here’s the ugly part. When it comes to retirement savings, defining your time horizon is particularly complex. That’s because you won’t be spending all your money at once. Rather, if for example you are ten years away from retirement, you have a ten-year time horizon on a small piece of your investments, an 11-year time horizon on another small piece of your investments, and so on and so on. Nothing’s easy, is it?

Thursday, April 9, 2009
Investments and Inflation Protection
As discussed in January 25’s post, inflation is just about inevitable. The nominal value of your investment may increase, but if it does not increase at a greater rate than inflation, its real value—its purchasing power—actually diminishes. So ideally you want your investments’ total return to exceed the rate of inflation.
How well do stocks and bonds achieve that goal? Historically stocks have done a better job of out-pacing inflation than bonds. Consider these statistics over the years 1926 through 2008. Stocks are represented by total return on the S&P 500; bonds are represented by total return on intermediate term Treasury bonds; inflation is represented by changes in the Consumer Price Index.
Geometric average annual nominal returns
Stocks: 9.62%
Bonds: 5.44%
Inflation: 3.01%
Geometric average annual real (inflation-adjusted) returns
Stocks: 6.42%
Bonds: 2.25%
Number of years (out of 83) experiencing a real (inflation-adjusted) loss:
Stocks: 27 (33%)
Bonds: 32 (39%)
The figures above look just at single-year periods. But that's short-sighted. Tomorrow’s post will take a more realistic look at how well stocks and bonds have increased purchasing power by analyzing longer periods.
Wednesday, April 8, 2009
Investments and Principal Protection
As you select the right mix of stocks and bonds for your retirement assets, consider this fundamental difference between them: When you own stocks, there is nobody guaranteeing that you will get back the amount you originally paid. With bonds, however, the issuer and its creditworthiness promise repayment. And when that issuer is the U.S. government, you can be sure your principal is protected.
But note that protection of principal is not the same as protection of value. A rise in interest rates or turbulent market forces can cause a bond to decrease in value even as the creditworthiness of its issuer remains unchanged.
And with both stocks and bonds, nobody is promising to repurchase the investment if you suddenly find you need to convert some of it to cash. For that, you are relying on the existence of an active and liquid marketplace—the stock or bond market—where buyers and sellers meet (anonymously) to set prices and make deals.
Tuesday, April 7, 2009
Investments and Liquidity
Liquidity in your investments is a good thing—like a slice of moist chocolate cake. And like chocolate cake, you have to pay for it. But since too much chocolate cake can make you sick, why pay for more than you’re gonna’ eat?
“Liquidity” is one of those words that jargonistas use to separate themselves from the rest of the world. All it means, really, is the ease with which you can convert an asset to cash. Can you sell it quickly, or are you locked into its ownership for a stated period of time (as with a certificate of deposit)? Is there a large active market for it (as with large capitalization stocks), or is it thinly traded (as with some small cap stocks)? Or is there no market for it whatsoever (as with many privately owned stocks not traded on any exchange)? What is the commission cost of selling? And the spread between prices buyers are offering and sellers are accepting?
Now this is important: You will find generally that you have to pay a price—in the form of lower total returns—for greater liquidity. Compare the total returns on a very liquid investment—U.S. Treasury Bills that are repaid in 30 days—with the total return on an equally creditworthy investment that is less liquid because it commits you to an interest rate for a longer period of time—Intermediate Term U.S. Treasury Bonds. Here are the (geometric) average total returns over the period from 1926 through 2008.
Average total return on 30-day Treasury bills: 3.70%
Average total return on intermediate term Treasury bonds: 5.44%
The average return on the less liquid bonds materially exceeds that of the more liquid 30-day bills. So it makes sense to assess your liquidity needs carefully, and not pay for more than you need. I know what you’re thinking, “But what if an emergency arises, and I need the money?” It’s wise to expect the unexpected. But it’s like buying insurance against disasters; you also have to consider the cost of the insurance and weigh it against the magnitude of the disaster. What will it cost you in your ultimate retirement security to have a large slice of your assets held in cash?
Monday, April 6, 2009
Volatility in Stocks and Bonds
If all you looked at were the historical average returns from stocks and bonds, as reported in April 3’s post, you would favor stocks over bonds any time. But of course those averages do not tell the whole story. You would be short-sighted if you simply ignore the volatility of those two asset classes.
An asset’s “volatility” is a measure of how much it tends to fluctuate in value. Stocks are much more volatile than bonds, as can be seen from the graph below. And that is to be expected given the greater degree of certainty in the promised returns inherent in bonds, and the greater degree of uncertainty companies face in their striving to earn profits in a competitive environment. You might think of volatility as one of the prices you pay for stocks’ higher historical returns.
A couple of points about volatility. First, stocks are very volatile—even turbulent. So you must be prepared, both financially and psychologically, to experience large drops in value before investing a significant part of your retirement funds in them. History has shown that swings in the stock market far exceed what would be expected if the market exhibited the same kind of tame randomness generated by the flip of a coin or the roll of the dice.
Second, volatility comes from the market itself—millions of investors making buy and sell decisions every day, spurred by their individual financial needs, their diverse opinions, their financial gamesmanship, and their psychology. To be sure, fundamental forces such as the state of the economy, the health of the issuer or its business sector, inflation, and the like, play an important role in determining whether a stock or a bond will go up or down. But these fundamentals are only half the story. The combined effect of millions of investors buying and selling creates its own turbulence, adding to the ups and downs of prices. This makes it impossible to consistently predict the direction of a market—any market—stocks, interest rates, real estate, oil, etc.—no matter how carefully you analyze the fundamentals affecting that market. Turbulence is an inherent characteristic of every market.
So, how much volatility can you afford as you strive for the superior average returns of stocks over bonds? More on that in future posts.
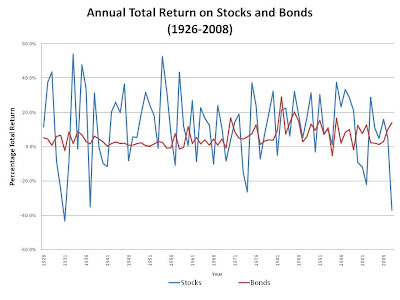

Sunday, April 5, 2009
Geometric vs. Arithmetic Average
In April 3's post, I referred to the geometric average. What in the world is that? Come on…You remember…You learned this in junior high school. Geometric average can best be understood in contrast to its cousin, arithmetic average.
Let’s say you’re talking to an investment advisor and he wants to give you a sense of what you might expect from a particular investment—maybe the stock market generally; or perhaps his own investment performance. He shows you a string of numbers for X years. Naturally, given the variation in returns from year to year, you want to get a sense of the average. The arithmetic average is simple enough: Add up all the annual returns and divide by X.
It’s simple, but it’s misleading. It leaves you with an inflated sense of the potential impact of the investment on your retirement assets. If you compound your investment at the arithmetic average rate, year after year, you’ll end up with a bigger number than you would in real life. That’s because variation in returns from year to year harms the overall long-term result. Up one year, down the next. The more the variation, the more the arithmetic average return overstates long-term performance. You may as well use your hat size.
What you really want to see—to squeeze out the impact of that variation on your projected future—is the geometric average return. Using that average, if you compound your investment at that rate for X years, you’ll get a realistic idea of what your assets would actually look like in real life over that period.
The actual formula for computing geometric return is kinda’ complicated, but spreadsheet programs like Microsoft Excel make it easy by including a function that computes the geometric average of a string of numbers. (In the case of Excel, it’s “Geomean(String of Numbers).” To make it work, you add one to each number in the string; apply the Geomean function, and then subtract one form the result.)
By their nature, the geometric average is always smaller than the arithmetic average (except where all numbers are identical, which never happens in real life). So if anyone quotes you the arithmetic average performance of an investment, beware. Intentionally or not, he is being misleading.
Oh, one more thing. Past average performance is not a predictor of future performance, so either average is misleading in that sense. But at least the geometric average is misleading in only one way, whereas the arithmetic average is doubly so.
Saturday, April 4, 2009
The Importance of Total Return
In yesterday’s post I asserted that when it comes to assessing the role of stocks and bonds in your retirement investing, total return is of paramount importance. Conversely, and more accurately stated, the distinction between yield and appreciation is of no real importance. It’s a red herring.
As pointed out in February 27’s post, for some purposes, yield is considered “income” and appreciation is considered “principal,” and for those limited purposes, the distinction between income and principal matters. But not for retirement planning.
But “wait,” you say, “when I start my retirement spending years, shouldn’t I spend income and preserve principal?” “No,” I respond. Utilizing that somewhat arbitrary distinction can cause you to distort your all-important asset allocation plan, to invest too much in bonds (in an effort to boost yield, i.e., income), or too much in stocks (in an effort to preserve the purchasing power of your assets). If your goal is to preserve the pot (and I’m not suggesting that should be your goal), then it’s much more rational to focus on total return and how that affects the percentage of your assets you can sustainably spend.
But “wait,” you say, “then might I not have to sell some assets to generate living expenses?” “Yes,” I respond, but so what? When you buy food, your grocer wants cash. She doesn’t care whether it came from yield or the sale of a share of stock. And cash can come from either income or principal.
But “wait,” you say, “won’t I incur costs in selling assets?” “Yes,” I respond, but commission costs are low and stocks are very liquid, making those costs immaterial compared to the cost of distorting your asset allocation plan.
But “wait,” you say, “what about triggering capital gain taxes?” “Duh,” I respond. First of all, a lot of your assets will be inside the shelter of your tax-favored retirement accounts, where realizing capital gains has no tax impact. And if some of the assets to be sold are in a taxable account, realizing capital gains taxes is actually much cheaper than paying tax on interest and dividend yields of a like amount. With capital gains, you only pay taxes on the appreciation portion of the amount you realize on sale, rather than on every dollar as is the case with interest and dividends. And usually at a bargain rate, too!
But “wait,” you say, “what if the stock has gone down in value? I’ll never get those dollars back.” “So what.” I respond. The act of selling a hammered stock makes you no poorer than if you keep it. It just makes the depreciation weigh more on your mind. The money was lost when the stock went down, not when you sold it.
So except for old-fashioned trusts, which few of us have, the distinction between yield and appreciation matters not a bit. What does matter—a lot—is the relative volatility and uncertainty of yields and appreciation (or depreciation). And that’s for another day.
Friday, April 3, 2009
The Nature of Stock and Bond Returns
Since investment returns play so big a role in your retirement security, as pointed out in March 30's post, it would be helpful to put those returns in perspective. Today’s post is my shot at that.
Stocks and bonds are projected to provide you with two types of returns, yield and appreciation, which together account for the investment’s total return. Here’s a bit more:
Yield. “Yield” is the current amount of cash you receive from your investments. Your yield on bonds comes in the form of interest, which is usually fixed. Your yield on stocks comes in the form of dividends, which are less certain: they may be reduced, increased or eliminated by the issuer at any time. Historically, especially in recent decades, yields on bonds have exceeded yields on stock. During the years 1926 through 2008, the average yields on stocks and bonds have been as follows (these are geometric averages, for anyone that’s paying attention).
Average dividend yield on stocks: 4.13%
Average interest yield on bonds: 4.68%
For the record, the stated averages for stocks was determined by looking at the S&P 500 index of U.S. stocks; and the averages for bonds was determined by looking at intermediate term U.S. government bonds. Yield, of course, is only half the return story. Stocks and bonds also gain and lose value.
Appreciation and depreciation. Stocks and bonds fluctuate in value, up (appreciation) or down (depreciation). A stock’s price will fluctuate with the fortunes of the company, its industry, the economy in general, and, importantly, the diverse needs, opinions, and whims of investors. A bond’s value will fluctuate with changes in interest rates, the issuer’s creditworthiness, and the needs, opinions, and whims of investors. It is important to recognize that many non-germane factors influence the prices of stocks and bonds—things like fear, greed, investment fads, and the like. Stocks exhibit much greater swings in value than do bonds. Here are the (geometric) average appreciation for stocks and bonds.
Average appreciation on stocks: 5.38%
Average appreciation on bonds: 0.73%
Total return. An investment’s total return is the sum of its yield plus its appreciation or minus its depreciation. That total return can be positive or negative. Total return is much more important than yield in assessing the role of stocks and bonds in your retirement planning. The (geometric) average annual total return of stocks has historically exceeded the average annual total return of bonds.
Average total return on stocks: 9.62%
Average total return on bonds: 5.44%
In my opinion, for the most part the distinction between yield and appreciation should be ignored. The only thing that really matters is total return. Why? That’s a subject for another post.
Thursday, April 2, 2009
The Overwhelming Importance of Asset Allocation
It’s fun to pick stocks. You buy a company because you think it’s an undiscovered gem or it’s going to grow like kudzu. Then you watch its daily performance, rooting for its price to go up as the rest of the world catches on to what you already recognized. It’s got all the excitement of a horserace.
But picking stocks, it turns out, is a sideshow.
What turns out to be most important is not which particular stocks you—or your investment advisor—pick, but rather to what degree you’re in or out of stocks. Or more precisely, how closely you hew to your asset allocation plan.
In a famous study, Brinson, Hood, and Beebower looked at the long-term investment performance of a group of pension funds, and attempted to attribute the variation in their performance to three factors: asset allocation, market timing (trying to get into or out of stocks at just the right times), and individual stock picking. The authors concluded that deviation from the funds’ asset allocation plan accounted for 93+% of the variation.
93%!
Picking stocks is fun. It gives you a horse to root for. But in the long run, it’s not nearly as important as picking the asset allocation that’s right for you, and sticking to the plan. Stock-picking is a sideshow. It’s the sizzle that sells the steak. But asset allocation is the steak that nourishes the body. That’s the main event.
And here’s the kicker. Selecting the right asset allocation is your job. Not your expensive investment advisor who gets paid for the other 7% of the results. It’s you! You’re a doctor or a plumber or a schoolteacher—something other than an investment professional. You can (and should) get guidance from your investment advisor as to the right asset allocation, given your age, financial circumstance, and psychological risk tolerance. But ultimately it’s your responsibility to tune the stock-bond knob. And nobody’s paying you anything to do that.
Now here’s another kicker. It turns out that selecting the “right” asset allocation is very hard. More on that in future posts. Much more.
Wednesday, April 1, 2009
How to Own Stocks and Bonds
In yesterday’s post, I asserted that there are effectively just two types of retirement investments—stocks and bonds. “Wait a minute,” you say, “there’s lots more than two. I’ve got mutual funds, I’ve got IRA’s.” Yes, you do. But these are just additional layers of legal structure which mask the nature of the investments that, at bottom, you ultimately rely on to grow your retirement security. Let’s look at a few ways to own stocks and bonds.
Physical Possession. The most direct way to own stocks and bonds is to have actual possession of the physical certificates that embody your ownership of the companies issuing the stocks and bonds. That is so twentieth century. Early twentieth century. You may get some misguided sense of security by having possession of shares of stock, but when you want to sell the stock, or you die or become incompetent, you won’t believe the hoops you (or your children) will have to jump through to transfer ownership. And each issuing corporation has its own set of rules, no two the same. So read the next paragraph, and then dematerialize your certificates.
Investment Account. You can open an account with a brokerage firm, and buy, sell and hold your investments inside your account, in the name of the firm. Your ownership of stocks and bonds is reflected in the electronic records of the broker. Then the process of buying, selling, owning, and transferring securities is much easier. You might be picking your stocks and bonds yourself, or relying on recommendations of the broker. How does the broker get paid for this advice? Often, indirectly, by earning commissions for the purchase and sale of securities. Sometimes from selling you securities it already owns, at a higher price than the broker paid.
Managed Investment Account. Rather than select individual stocks and bonds yourself, or with the recommendations of your broker, you can hire a registered investment advisor to do that for you. You still own the account, but you authorize the brokerage firm to take investment direction from the investment advisor. Of course you pay a fee to the investment advisor for this service, and you continue to pay commissions to the brokerage firm for executing buy and sell instructions.
Investment Manager’s Account. You might open an account with the registered investment advisor, who then pools the securities owned by a whole bunch of his clients. This big pooled account is then held at a brokerage firm. Your share might be, say, 1% of the investment advisor’s omnibus account, and each month or quarter or year, you’ll get a statement showing your equitable ownership of the securities. So now there are two layers between you and your stocks and bonds—the investment advisor and the broker.
Wrap Account. Some brokerage firms offer “wrap accounts” which impose one bundled fee, including both investment advice and brokerage commissions. The broker and the investment advisor split this fee in some way that may be opaque to you. One fee sounds better than two, but not if it turns out to be bigger than two fees added together.
Mutual Fund. It has been become very popular for individual investors to own stocks and bonds through a mutual fund. Essentially you and all the other owners of the mutual fund have pooled your assets, which then are collectively managed by the mutual fund manager, a professional investment advisor hired by the mutual fund to pick stocks and bonds. If you “sell” some shares of the Fund, at the end of the trading day the Fund redeems the shares at the net value of its underlying assets. You still pay brokerage and investment management fees, but they are pooled inside the fund. From your perspective, what counts most is the proportion of stocks and bonds held by the fund. You can get a general sense of what that is from the fund’s prospectus, which sets out the fund’s goals; e.g., this fund will invest in European stocks, or that fund is a balanced fund investing in both stocks and bonds within stated ranges.
(An aside. I learned recently that Quicken, a popular computer program for keeping track of your investments, actually helps you know how much of each asset class you own on any given day by looking inside your mutual funds, and seeing their current proportion of each asset class. Cool. It’s all done automatically for you so you can keep tighter control of your asset allocation if you want.)
Index Mutual Fund. An index mutual fund is just like any other mutual fund, but its internal fees are cheaper because the investment advisor is called upon to make essentially no investment decisions. Instead the advisor merely tries to replicate a recognized index, e.g., the 500 largest U.S. stocks. A monkey could do it. But then you'd have to pay the monkey 10 or 15 basis points, or it'll throw feces at you.
Exchange Traded Funds. Exchange Traded Funds, or ETFs, are similar to mutual funds, in that you equitably own a small percentage of all the Fund’s stocks and bonds. The managers of the Fund use a bunch of techniques to try to keep the Fund’s market value as close as possible to the underlying net asset value of the Fund’s investments. One difference between Exchange Traded Funds and mutual funds is that Exchange Traded Funds can be bought or sold throughout the day, rather than being limited to end-of-day transactions.
Fund of Funds. Some mutual funds invest in other mutual funds, adding another layer of legal ownership between you and your stocks and bonds. For example, those increasingly popular life-cycle funds, which dial down the stock percentage as you age, are often structured as a mutual fund which itself owns shares of both stock and bond mutual funds.
Savings Buckets. Your government has kind kindly created different types of savings buckets with favorable tax characteristics, such as 401(k) plans, Individual Retirement Accounts, and Roth IRA’s. Your stocks and bonds can be housed inside these buckets, adding another layer of legal structure between you and your investments. And if you’ve got your IRA invested in a fund of funds, you’re talking about three layers of legal structure. It boggles the mind.
Bank Accounts. You might have your money sitting in a bank. If it’s in a deposit account, like a checking account, savings account or a certificate of deposit, then you’ve got a "bond" of sorts. You have lent your money to the bank, for which it is paying you interest (not too much interest, these days). And if the bank is FDIC-insured, repayment of your loan is guaranteed by the United States government, within limits.
Variable Annuity. In prior posts, for example March 10’s post, I’ve discussed the pros and cons of pure annuities, where, in exchange for some of your dough, the insurance company promises to pay you $X per month for as long as you live. A pure annuity is bond-like. But there are variations on that investment, called variable annuities, where the insurance company invests your premium in an underlying pool of securities that might be some combination of stocks and bonds, and the value of your annuity fluctuates with the ups and downs of the pool. The insurance company charges a fee for managing the underlying pool of assets, but it’s often hard to know how much you’re paying, since the fees are all bound up with its mortality charges—the amount it charges for taking the risk that you’ll live as long as those yogurt-eaters from the Caucasus.
Of course the type of ownership structure you choose is important, as that affects the fees you pay, your tax characteristics, and the investment performance you expect. But most important to your long-term retirement security are your equitable ownership percentages of stocks and bonds, which can be buried pretty far down the chain.
Subscribe to:
Posts (Atom)